
November 17, 2023
Welcome to N+1 Action, where we bring you up-to-date performance metrics for our trading algorithms and portfolio insights along with the latest data on macro economic and media trends.

Hello Investors,
⭐️ Welcome to N+1 Action, where we bring you up-to-date performance metrics for our trading algorithms and portfolio insights along with the latest data on macro economic and media trends.
If you're a new subscriber, check out our How-to-Guide to get the most value out of our algorithmn and portfolio tables.
Safe Trading,
The N+1 Team

AI Trading Insights
AI Trading Insights
N+1 Analytics’ builds automated trading algorithms for buying and selling crypto coins such as bitcoin and ethereum. We apply AI and advanced statistical models to technical and historical information. Our algorithms monitor and analyze crypto markets and on-chain data 24/7.
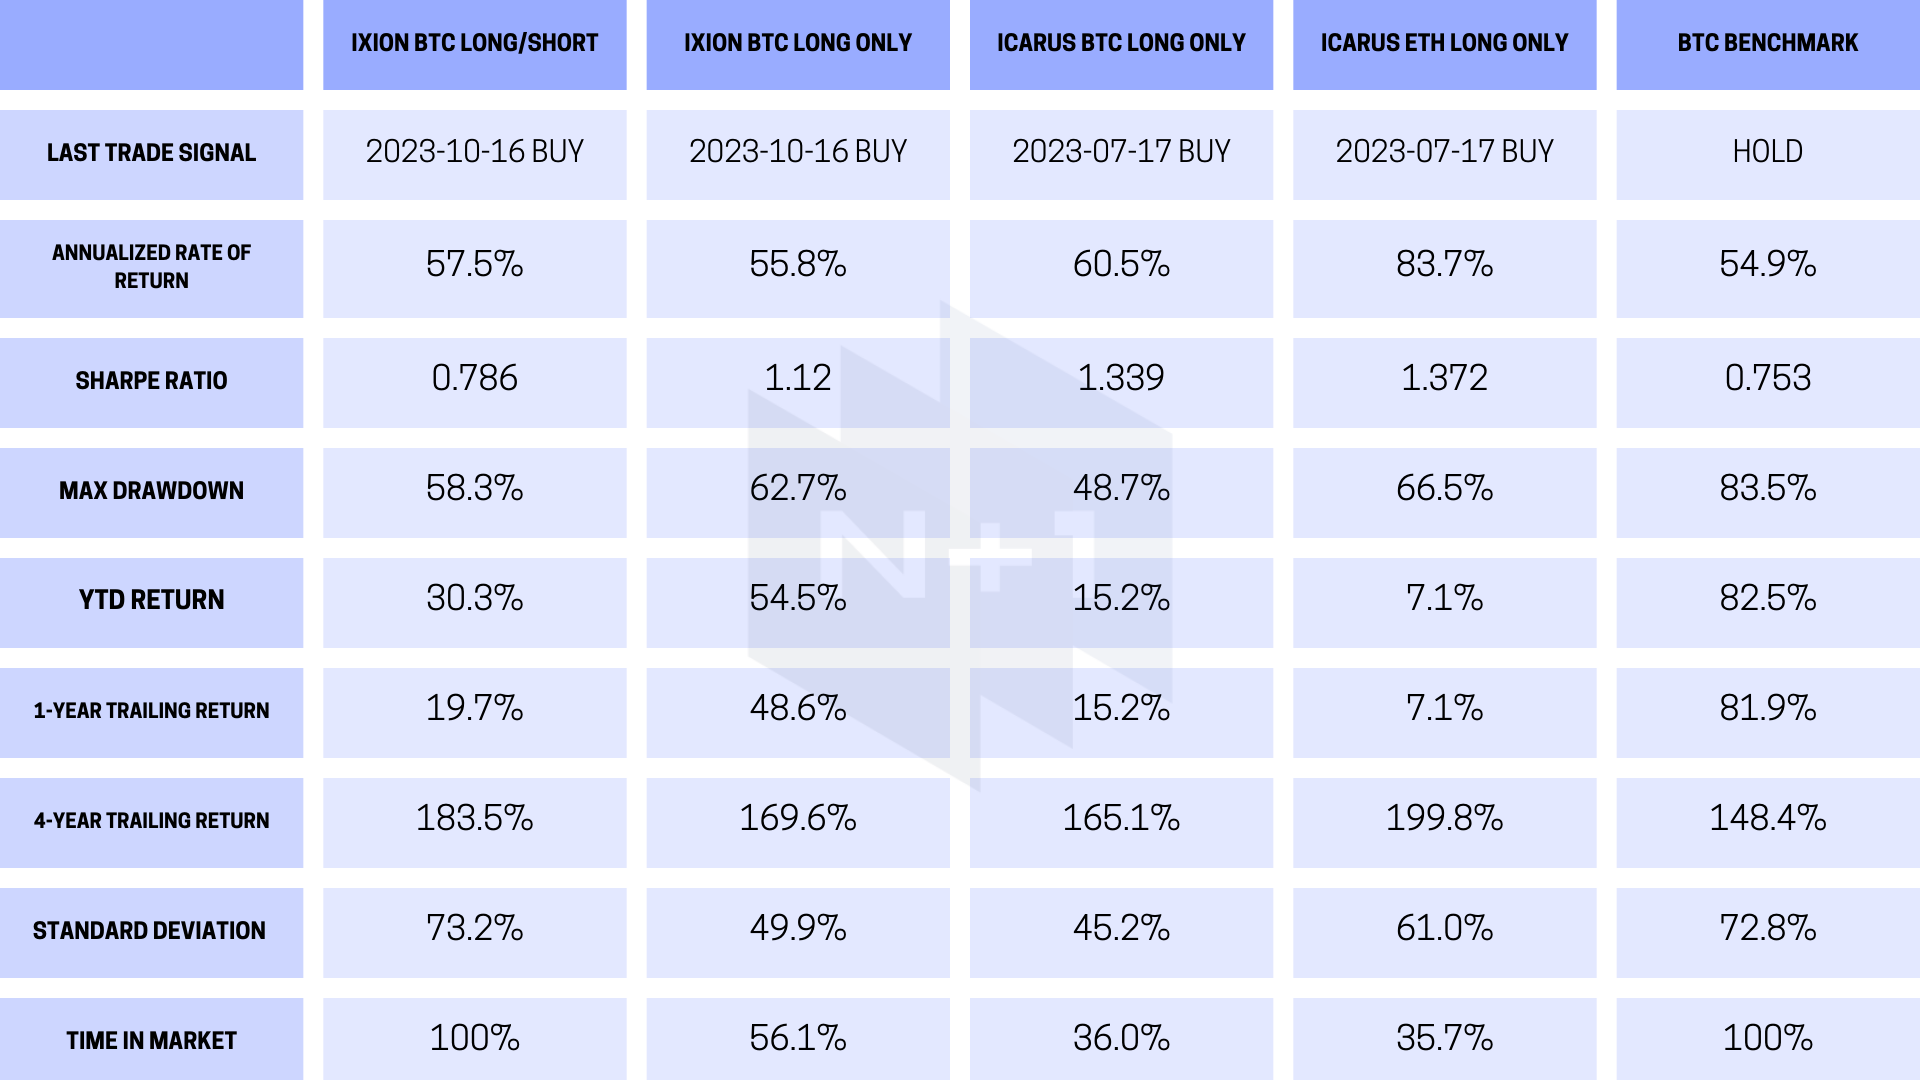
The following table shows different ways of using our trading algorithms Ixion and Icarus and describes various standard performance metrics.
- Ixion BTC Long/Short trades BTC long and short.
- Ixion BTC Long Only and Icarus BTC Long Only buys and holds BTC or sells BTC into a cash position.
- Icarus ETH Long Only buys and holds ETH long or sells ETH and holds cash.
- BTC Benchmark is buy and hold BTC, which is a commonly used benchmark
Portfolio Insights
Portfolio Insights
A common method to gain long-term risk adjusted exposure to an industry is by building a portfolio of diverse assets. There are many different ways to build a portfolio. In Portfolio Insights, we explore various ways of constructing robust crypto portfolios based on a common basket of 20 coins*. We included the top 20 coins based on market capitalization starting January 1, 2019, and rebalanced the portfolio once a year. We excluded stablecoins such as Tether (USDT) and USD Coin (USDC), as well as coins with trading volumes below $1,000,000 in a 24-hour period and controversial or known ‘scam’ coins.
We use AI and data analytics to create four different portfolios that provide broad exposure to the crypto market with the goal of maximizing return through various risk adjusted methods (see glossary). During “crypto winters”, BTC tends to outperform a diverse portfolio. However, a portfolio can outperform BTC in market up trends.
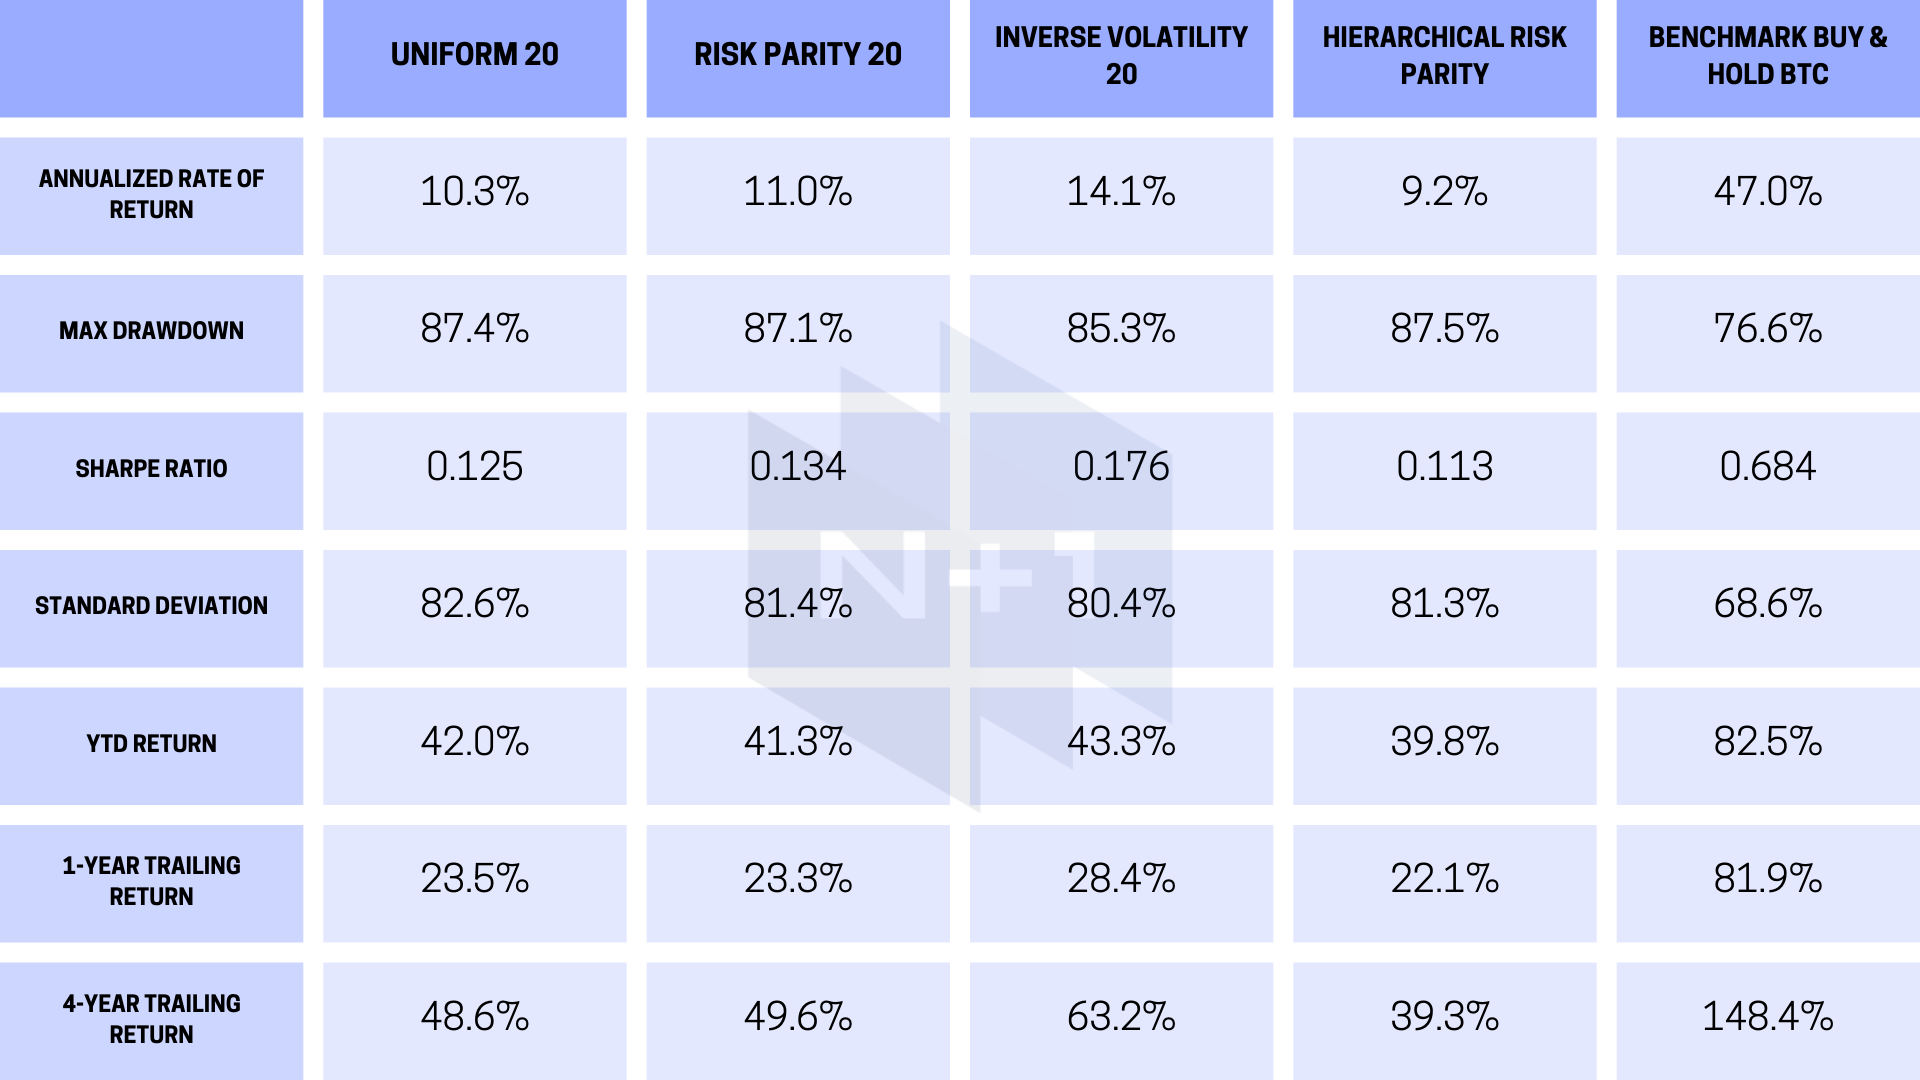
*N+1 20: Bitcoin, Ethereum, Ripple, Litecoin, BNB, Bitcoin Cash, Solana, EOS, Cardano, Dogecoin, Stellar, Polkadot, Polygon, TRON, Monero, Chainlink, Avalanche, IOTA, Shiba Inu, Tezos, Theta Network, Cronos, Uniswap, Dash, Huobi Token, NEM, NEO, Algorand, Ethereum Classic, VeChain, Toncoin, Zcash, Celsius, NEAR Protocol, Waves, Cosmos, OMG Network, Maker
Macro Insights
Macro Insights
The larger macro environment has an important effect on crypto asset prices. The macro environment includes analysis of important economic factors such as Gross Domestic Product, Money Supply, Government and Corporate Interest Rates, Liquidity Flows, as well as price actions across major asset classes (.e.g, equity, commodities, bond, etc..). These economic, financial asset and crypto indicators are critical for assessing the potential future direction of the cryptocurrency market.
📊 Scoring System - each economic, financial asset, or crypto indicator is given a score of -1 for bearish, 0 for neutral, and +1 for bullish. These scores are then added up and averaged for each section.
- Economic Indicators I
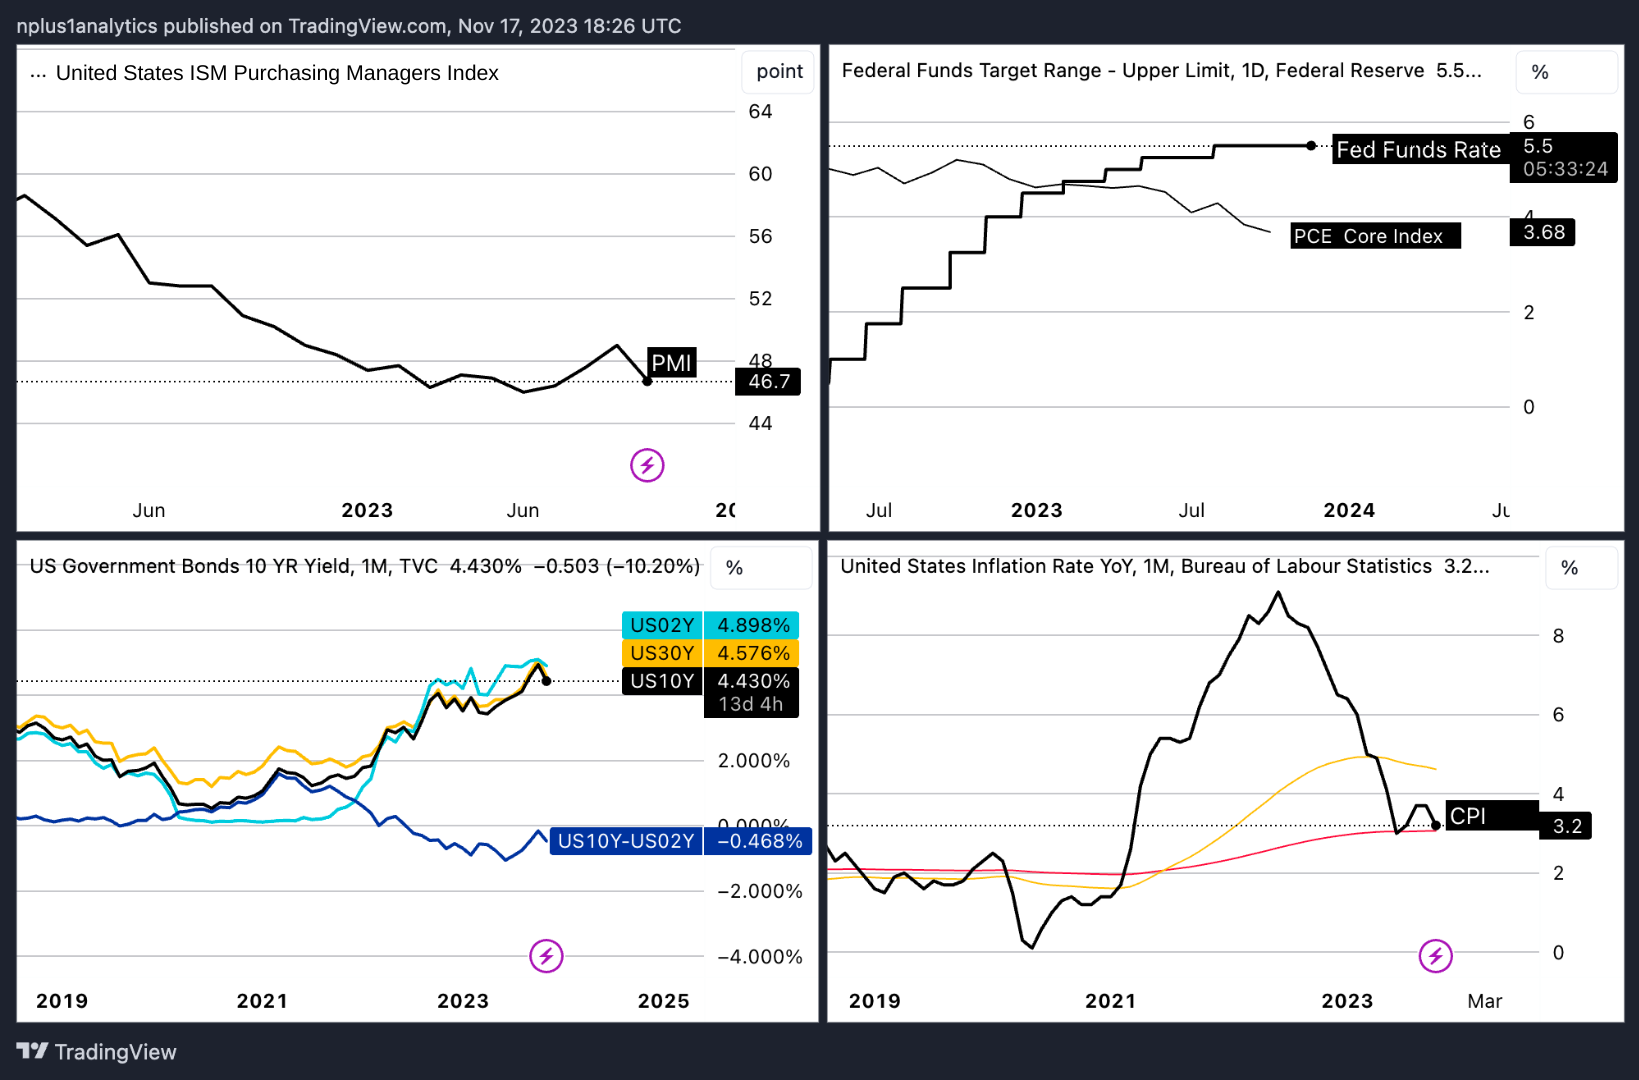
This set of economic indicators has a score of -0.75 for a bearish prediction for BTC.
-
U.S. ISM Purchasing Managers Index (PMI) - Reflects changes in the purchasing managers' orders in the economy. When the number is above 50 the economy is expanding and when it is below 50 it is contracting. The PMI is below 50 and in a downtrend and thus is negative for BTC = -1
-
Federal Funds Rate (bold black), PCE Core Index Annual Change (fine black) - Shows the short-term interest set by the Federal Reserve. This is a key contributing factor to overall economic interest rates which strongly impact financial assets and decreases in Fed Funds Rate increases the value of risky assets. The Federal Funds Rate is in an uptrend and thus BTC = -1
-
10-2 Year Yield Curve (blue), 2-Year Yield (light blue), 10-Year Yield (dark red), 30-Year Yield (yellow) - Reflects the risk-free rate for the next 10 years. The Yield Curve is an excellent predictor of U.S. economic recessions. The yield curve is currently inverted and suggests a recession is coming 12-18 months after inversion. Treasury Yields are in an uptrend and the Yield Curve is negative for BTC = -1
-
Consumer Price Index (CPI), 200-bar moving average (red), 50-bar moving average (yellow)- Reflects the inflation rate. When inflation is high the value of non-fiat currencies or money hedges like bitcoin or gold rises due to their fixed supply. Over the last year inflation is rising. CPI is neutral for BTC = 0
2. Economic Indicators II
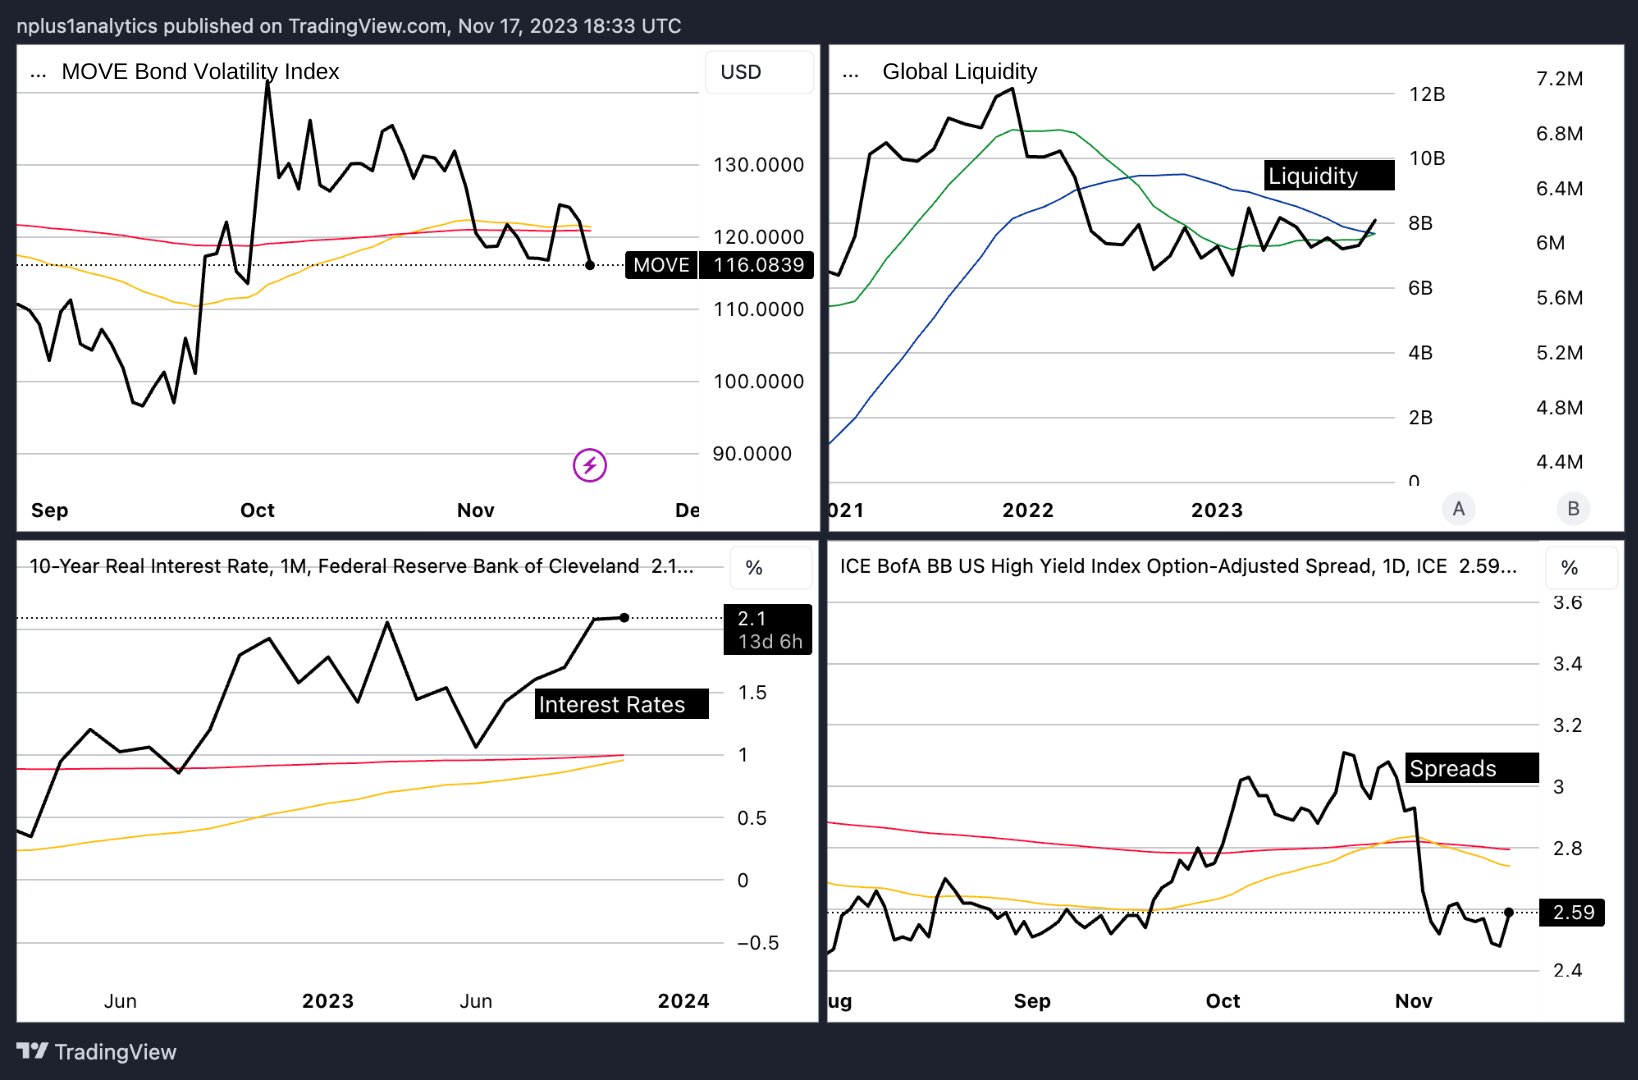
The second set of economic indicators have an average score of 0 for a neutral prediction for BTC.
-
Move Bond Volatility Index, 200-bar moving average (red), 50-bar moving average (yellow) - Measures the functioning and liquidity in the bond market. When this number is above 140 or increasing it shows that the Fed is losing control of the bond market. In the short run, a loss of control in the market is negative for BTC. The Move Index is currently positive for BTC = +1
-
Global Liquidity, 21-bar moving average (blue), 9-bar moving average (green) - Measures the increase and decrease in the Global Central Bank's balance sheets. When the Central Bank balance sheets increase, liquidity increases and BTC prices increase. When balance sheets decrease, liquidity decreases and BTC prices decrease. Global liquidity is negative for BTC = -1
-
Real Interest Rates, 200-bar moving average (red), 50-bar moving average (yellow) - Measures the time preference for consuming current goods versus future goods. Real interest rates are inversely related to gold and bitcoin prices. In the last year real interest rates have risen; however, recently real interest rates are on the decline. This suggests both upward and downward pressure for assets like gold and BTC. Real Interest Rates are negative for BTC = -1
-
Corporate Spreads, 200-bar moving average (red), 50-bar moving average (yellow) - Shows the spread or difference in yield between investment grade corporate credit (BBB) and 10-year treasury yields. As this spread decreases, risky assets like bitcoin should rise. Corporate Spreads are negative for BTC = +1
3. Financial Asset Indicators I
This section of finanical asset indicators has a overall score of 0 for a neutral prediction for BTC.
-
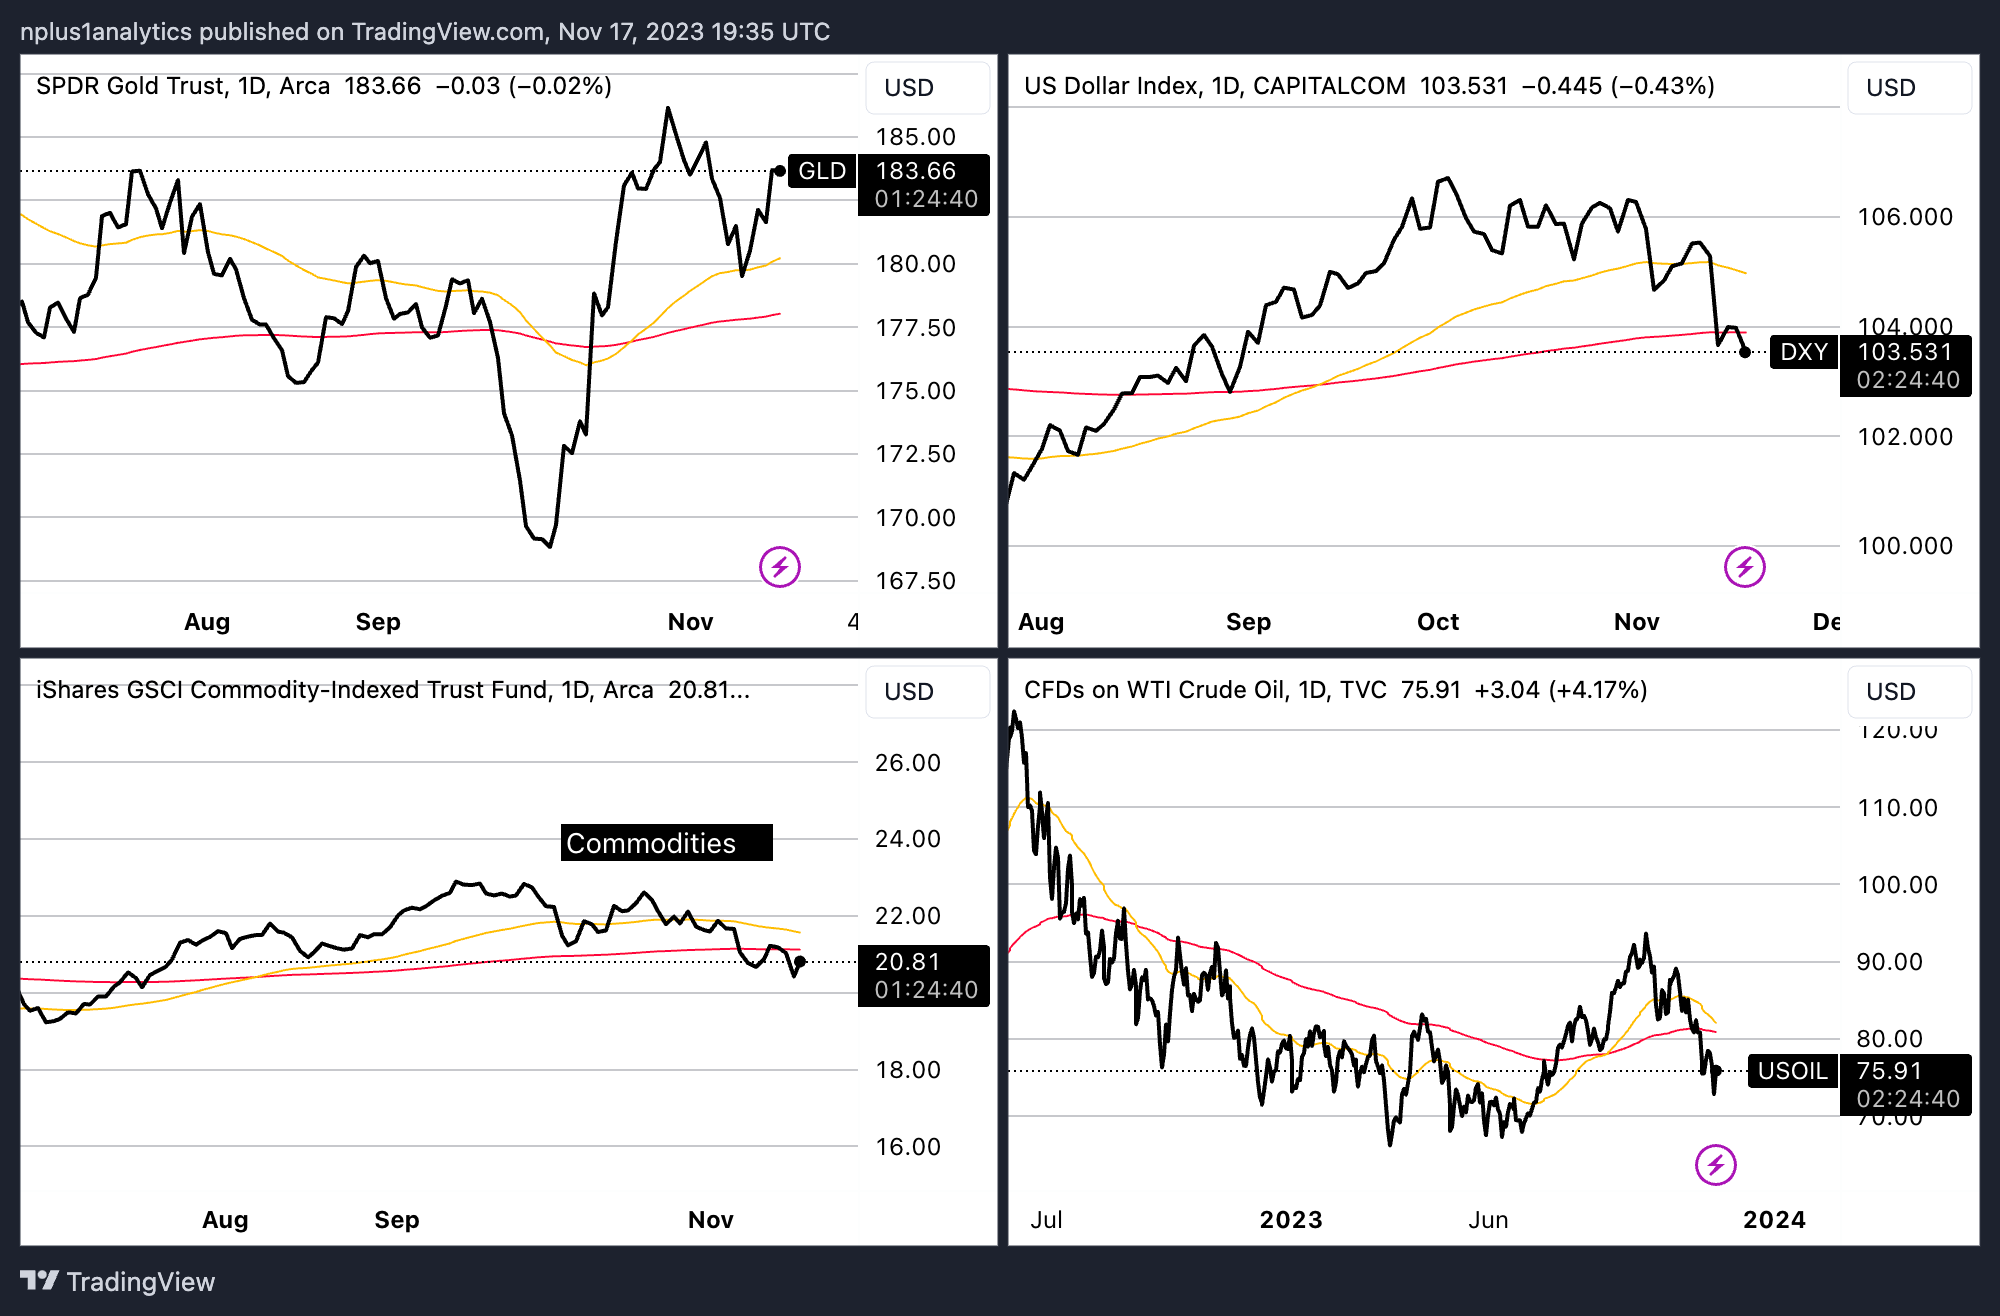
Gold, 200-bar moving average (red), 50-bar moving average (yellow) - Gold is a scarce asset and thus used as a hedge against inflation inherent in fiat currencies. BTC has commonly been compared to gold as a digital alternative to fiat and generally the prices move together. The Gold price is positive for BTC = +1
-
U.S. Dollar, 200-bar moving average (red), 50-bar moving average (yellow) - The U.S. dollar is the world's reserve currency and most commonly used fiat currency. The dollar is viewed as the fiat-based standard and competitor to non-fiat currencies (BTC, Gold, etc). When the dollar is strong, non-fiat currencies lose value. The U.S. Dollar is negative for BTC = +1
-
Commodities, 200-bar moving average (red), 50-bar moving average (yellow) - These are baskets of goods used in economic production and consumption. This indicator helps give insight in terms of GDP growth and potential inflation concerns. Strong demand for commodities with low levels of CPI puts the economy in a growth position, which can be good for BTC. Commodity prices are positive for BTC = -1
-
Oil, 200-bar moving average (red), 50-bar moving average (yellow) - The most commonly used commodity and most important input for economic production. Similar to commodities above, when demand for oil is high alongside low levels of CPI, it positively contributes to GDP growth and ultimately BTC value. Oil prices are in range and thus BTC = -1.
4. Financial Asset Indicators II
The second set of market asset indicators have a score of +1 for a bullish price prediction for BTC.
-
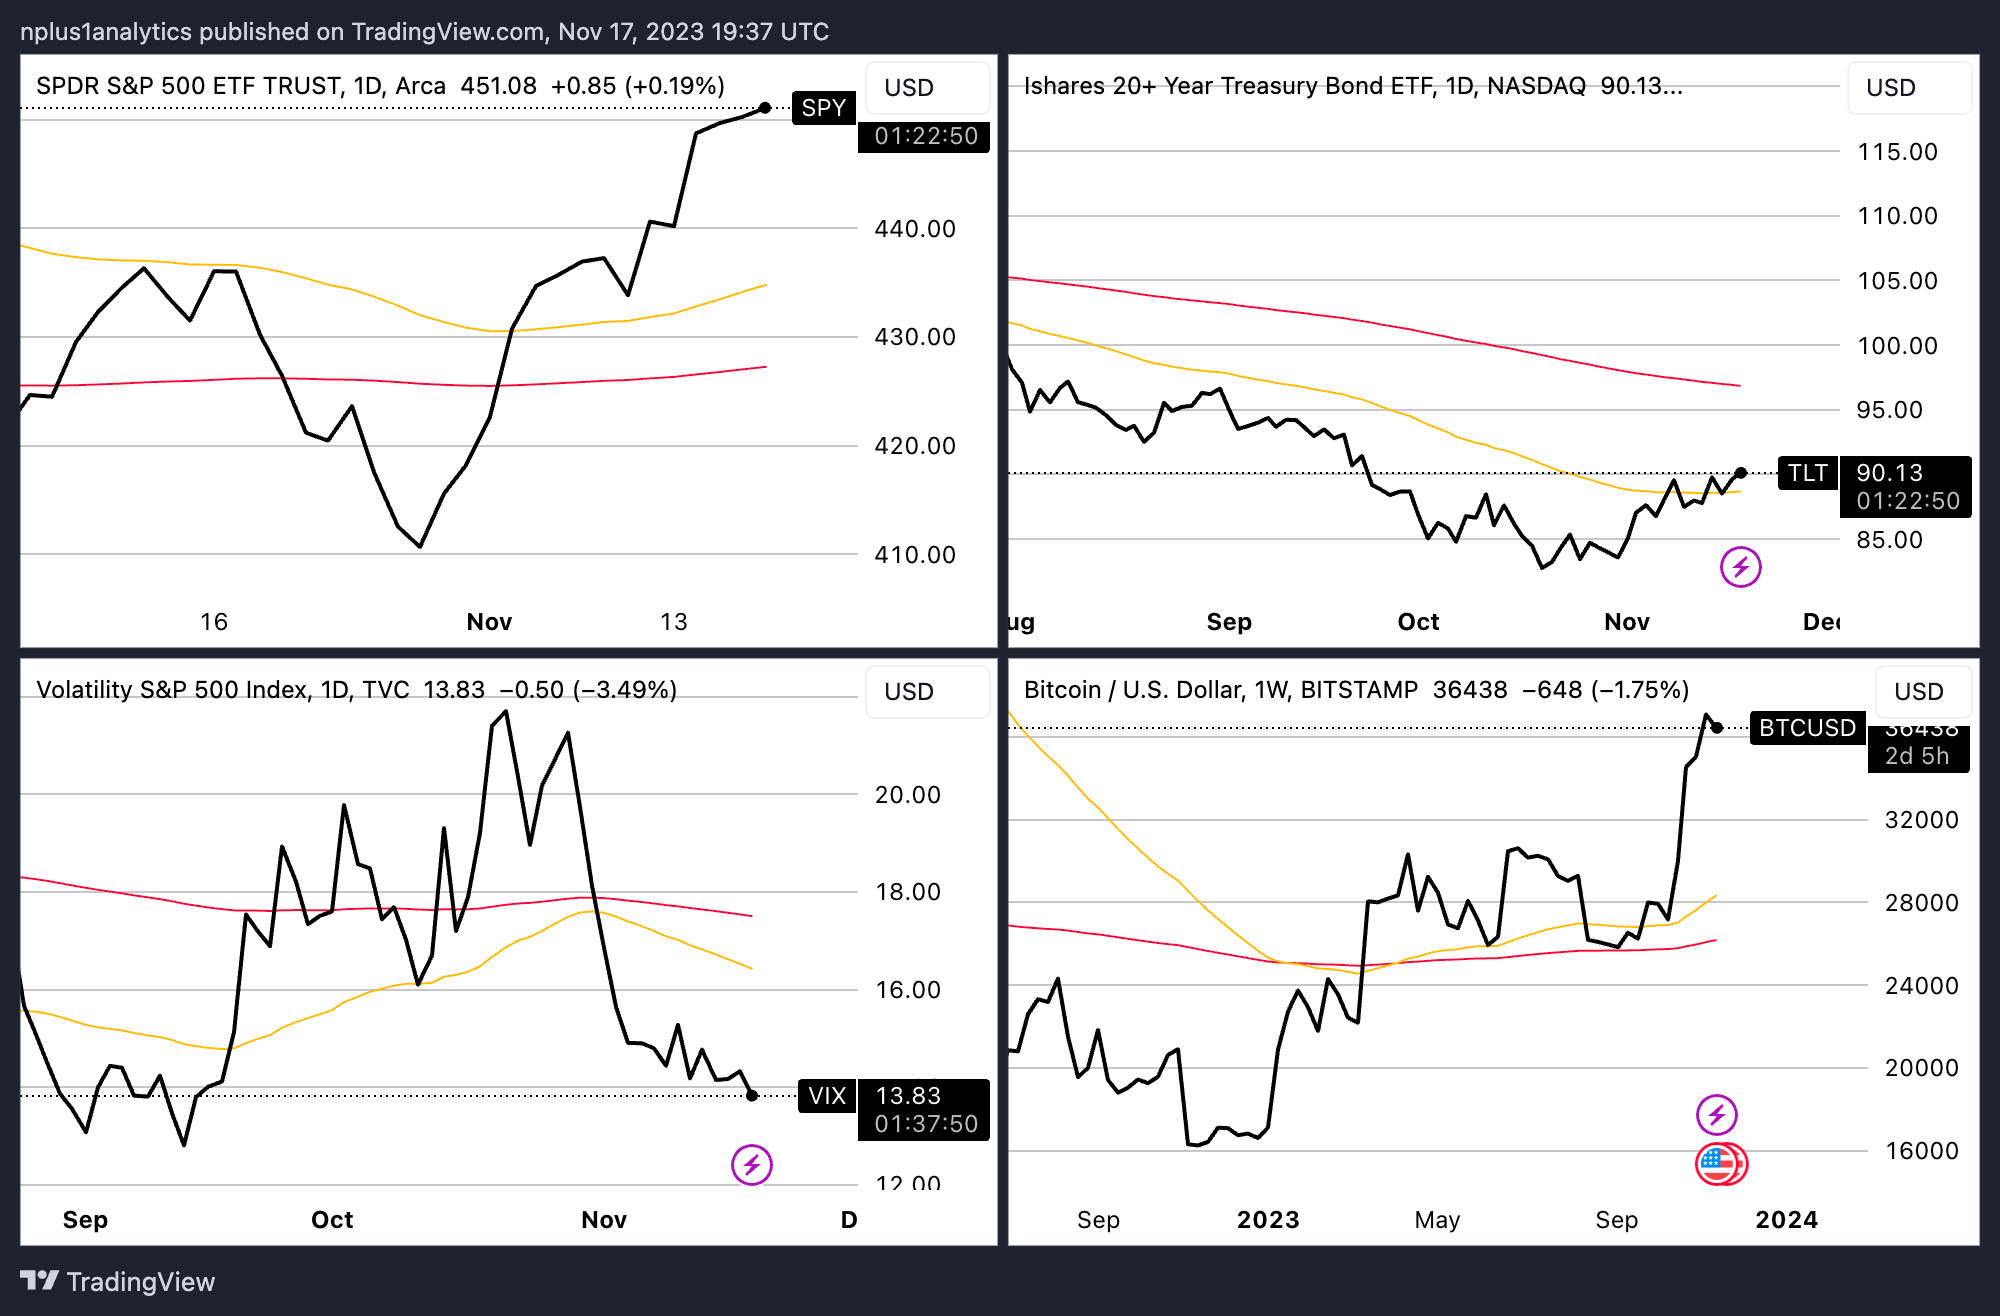
S&P 500, 200-bar moving average (red), 50-bar moving average (yellow) - The most comprehensive basket of U.S.equities used as an economic health indicator. Since BTC is a growth asset, its performance is levered to more traditional assets like equities. The S&P and especially the tech components of the U.S. equities markets are an indicator of the general risk-on environment. When these financial assets rise, BTC should rise too. The S&P 500 is positive for BTC = +1
-
TLT, 200-bar moving average (red), 50-bar moving average (yellow) - Reflects 20+ year treasury bond prices. Under normal economic environments, bonds are considered as an alternative to equities and risk-on assets. When bond prices go up, equity and risk assets go down. TLT is positive for BTC = +1
-
VIX, 200-bar moving average (red), 50-bar moving average (yellow) - Reflects the volatility in the S&P which can help provide insight into the extremes of market moves. This helps provide clarity as a confirmatory signal to market direction. A market move that is down with high volatility could mean we are seeing a change in market direction. The Vix is positive for BTC = +1
-
BTC, 200-bar moving average (red), 50-bar moving average (yellow) - In normal times BTC prices follow a momentum logic. That is past decreases (increases) in prices lead to future decreases (increases) in prices. During market extremes or non-normal times BTC often follows a reversion to the mean logic. That is past decreases (increases) in prices lead to future increases (decreases) in prices. BTC is currently in a momentum logic and prices are rising. Past BTC prices are positive BTC = +1
There are important macro trends in the crypto market. For example, we have been following the four-year halving cycle to plan for trends in the market. You can read about it in our Insight: Bitcoin’s halving cycle - What it means for your investment. They are observable through metrics that measure market activity over long periods of time, often years. Macro indicators can help make long-term decisions about market direction and price movement. Macro Insights features two bitcoin indicators that show when it is under and overvalued over the four-year halving cycles, MVRV and Stock-to-flow. These crypto indicators are critical for assessing the potential future direction of the cryptocurrency market.
Why this indicator?
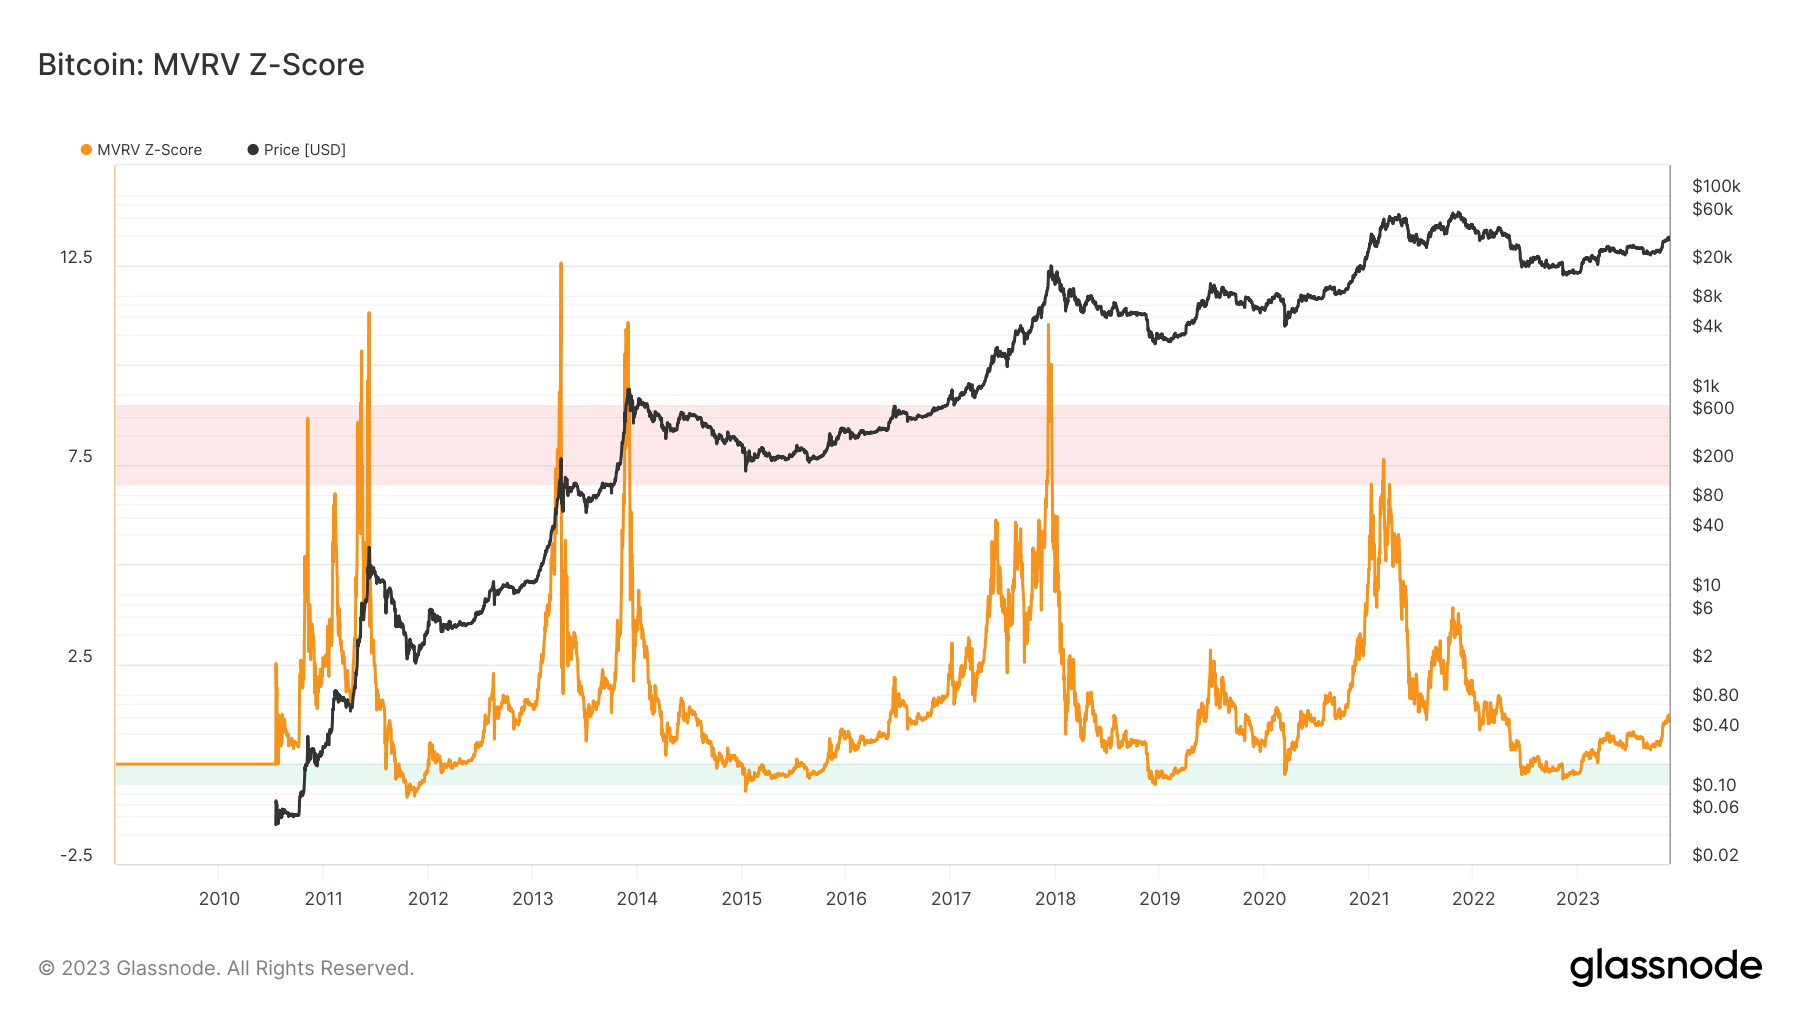
MRVR - The Market Value to Realized Value metric is calculated by dividing the Market Cap (paper value) by the Realised Cap (last transacted price). This indicator helps us understand when BTC is overvalued and undervalued relative to its “fair value.” When the indicator is high, in the red zone, BTC tends to be at a trend price peak and overvalued. When the indicator is low, in the green zone, BTC tends to be at or near a market bottom and undervalued.
MRVR is undervalued for BTC = +1
Why this indicator?
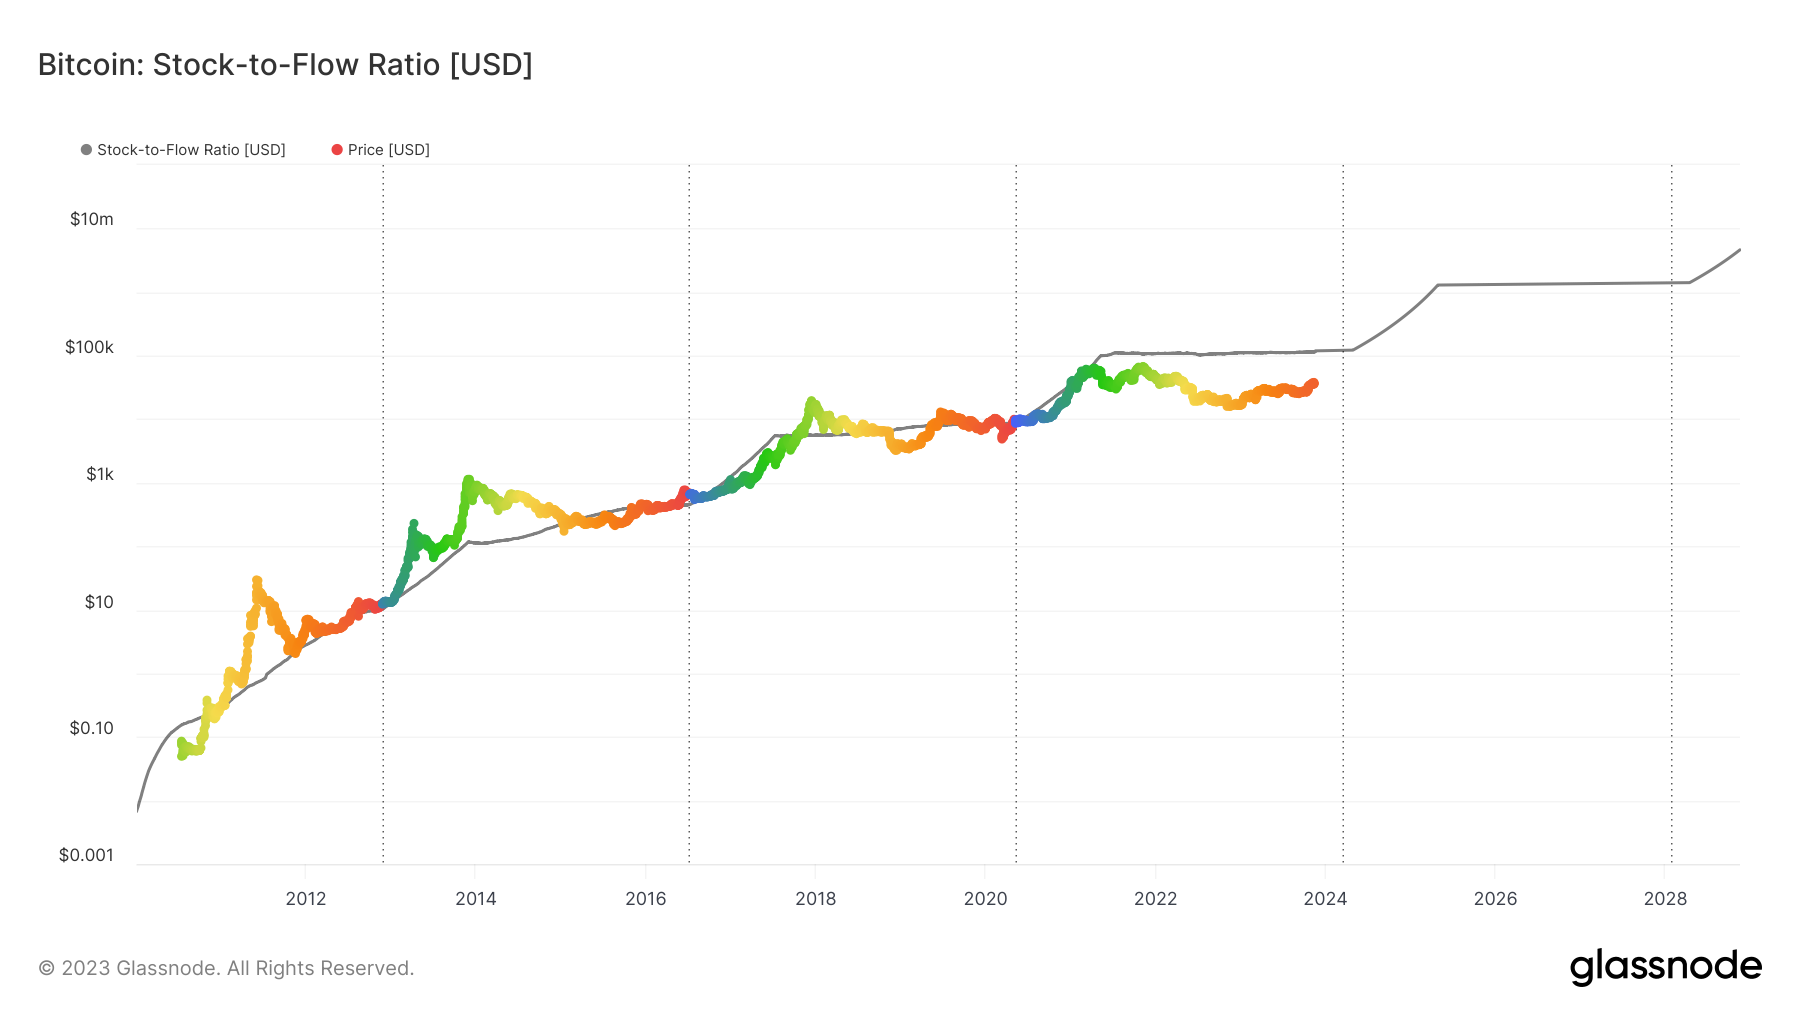
Stock-to-Flow (S2F) - The BTC S2F model is based on the principle that bitcoin’s value can be understood by measuring scarcity and observing it over time against the four-year halving cycle. This model compares its circulating supply, or stock, to its annual incoming supply, or flow. A higher S2F ratio signifies that the asset is scarcer and therefore more valuable. This is a macro level indicator showing how BTC price is performing based on long term supply as a commodity like gold or oil.
We use the S2F model to predict bitcoin’s future price. When price is above the S2F line, BTC tends to be overvalued. When price is below the S2F line, BTC tends to be undervalued. In addition, BTC tends to be at its most undervalued point when it is a year before the halving, which is when price turns blue. According to the S2F model, the best period to buy BTC is when it is orange.
Stock to flow is undervalued for BTC = +1
Price prediction for BTC: Bullish
Media Insights
Media Insights
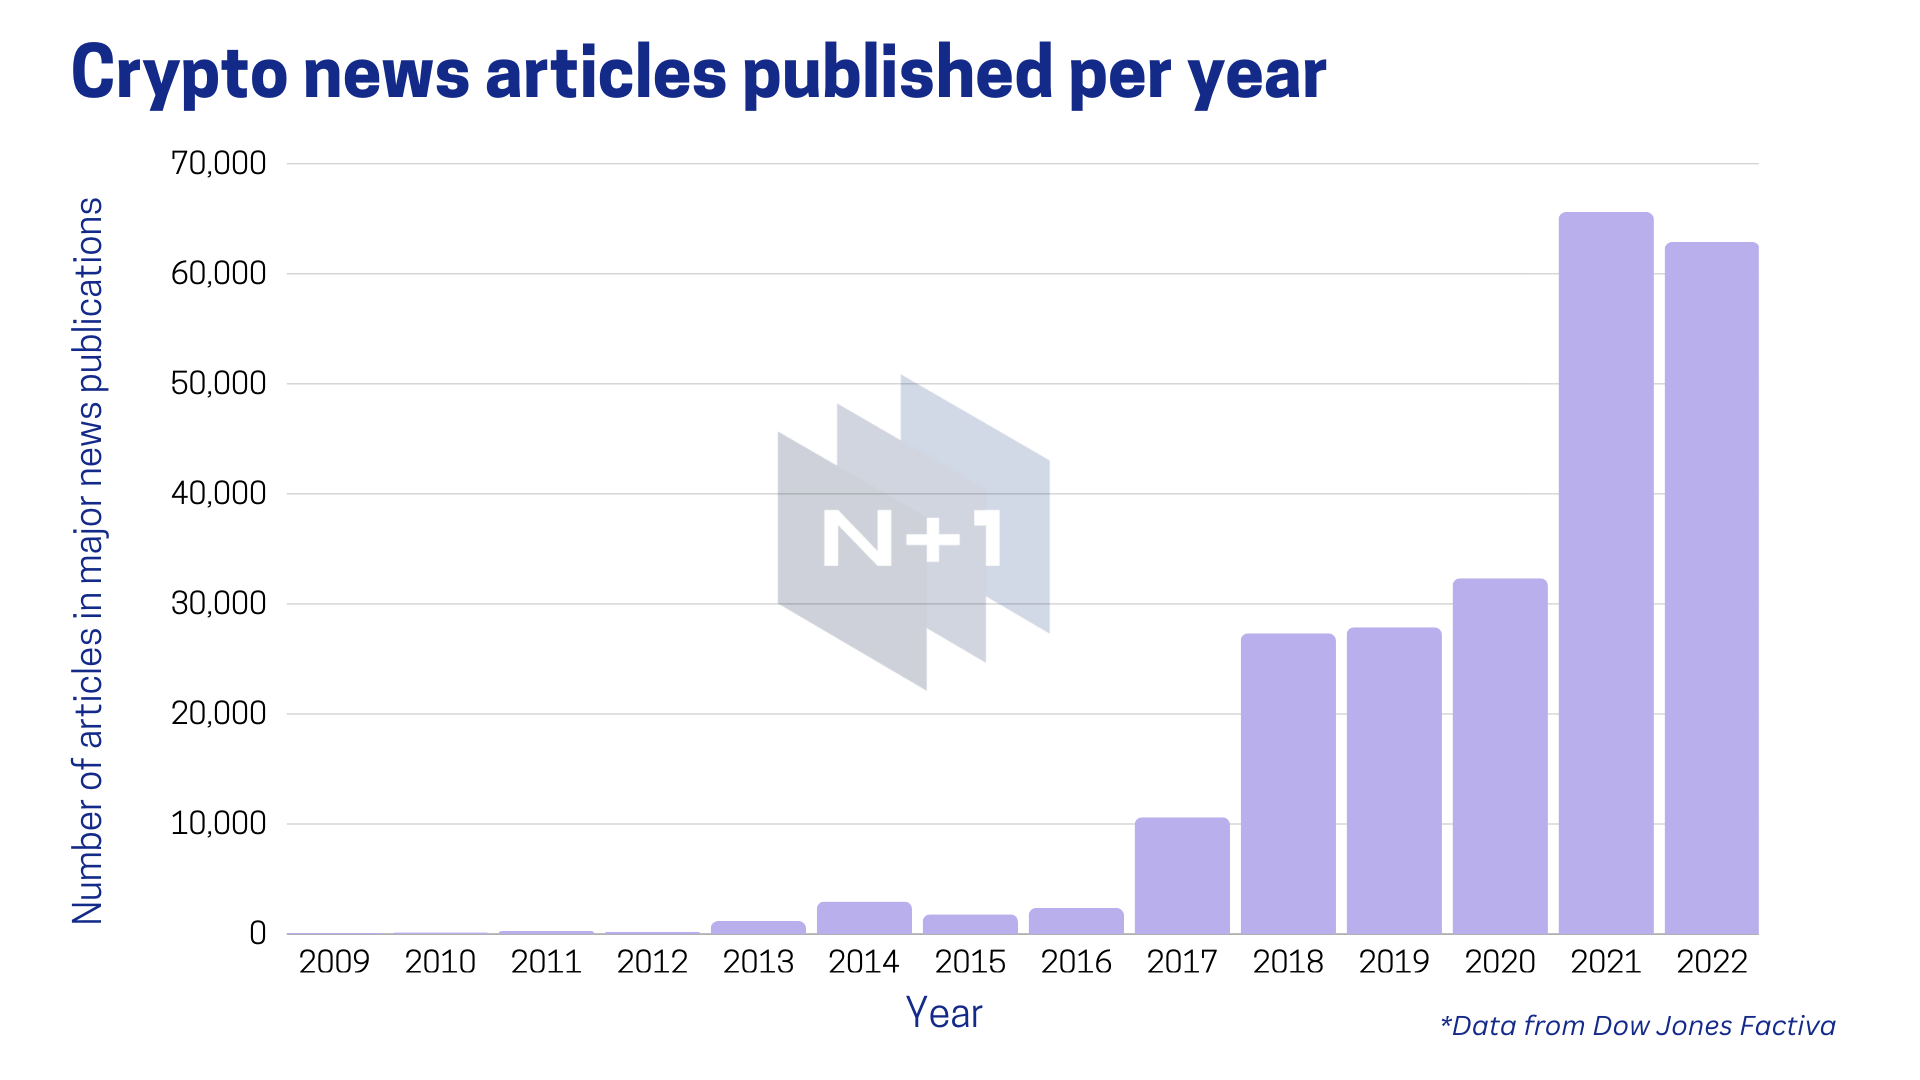
The media plays an important role in the development of the crypto market. However, its role is not well understood or measured. The media shapes information flows about crypto and focuses our attention on some things and not others. In short, the media plays a strong role in creating the crypto agenda and framing the narratives. Thus, it influences what and how we think about crypto. Our communication science team illustrates crypto narratives in various types of media streams such as news and social media. We develop Media Insights on the relationship between media and crypto price action, volatility and popularity.
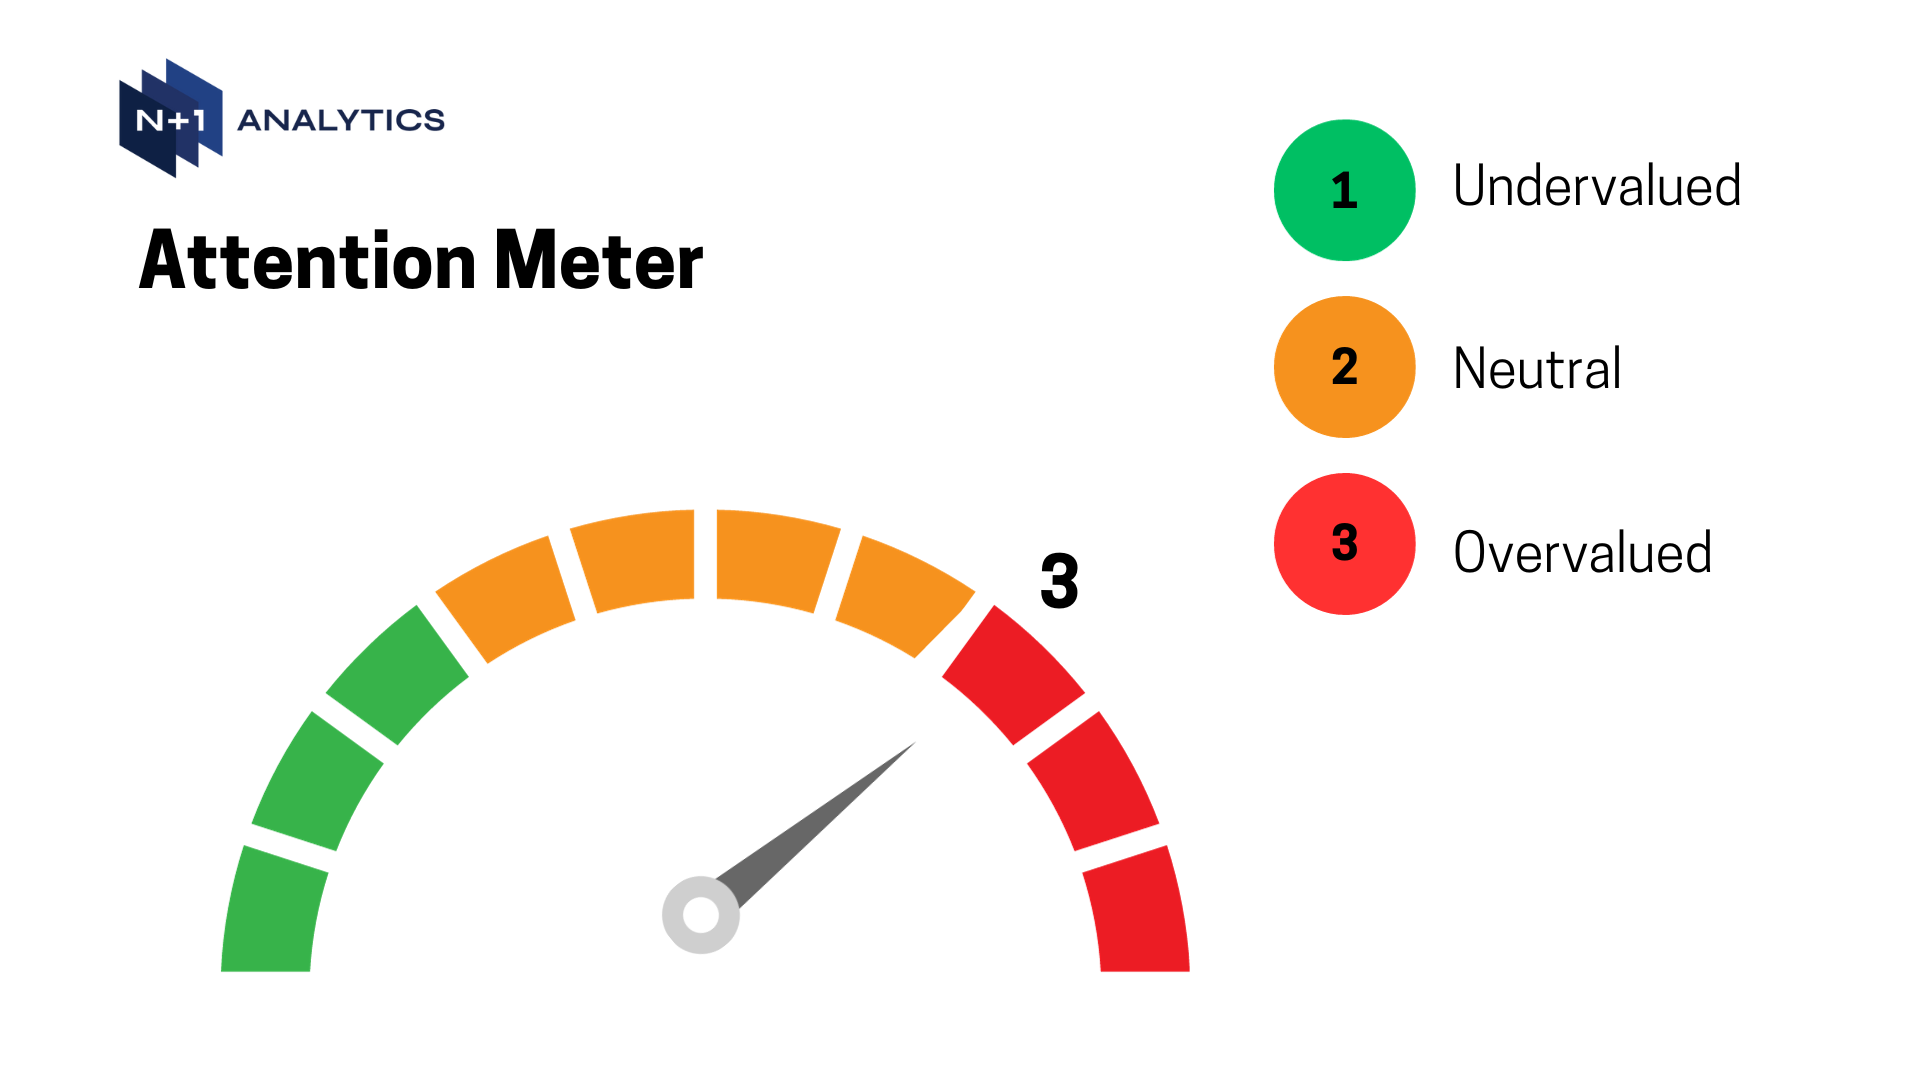
We feature two types of media flows that measure crypto topics: 1) Google Trends and 2) Wiki page views. These media flows provide a measure or proxy for periods of over and under attention in the crypto market.
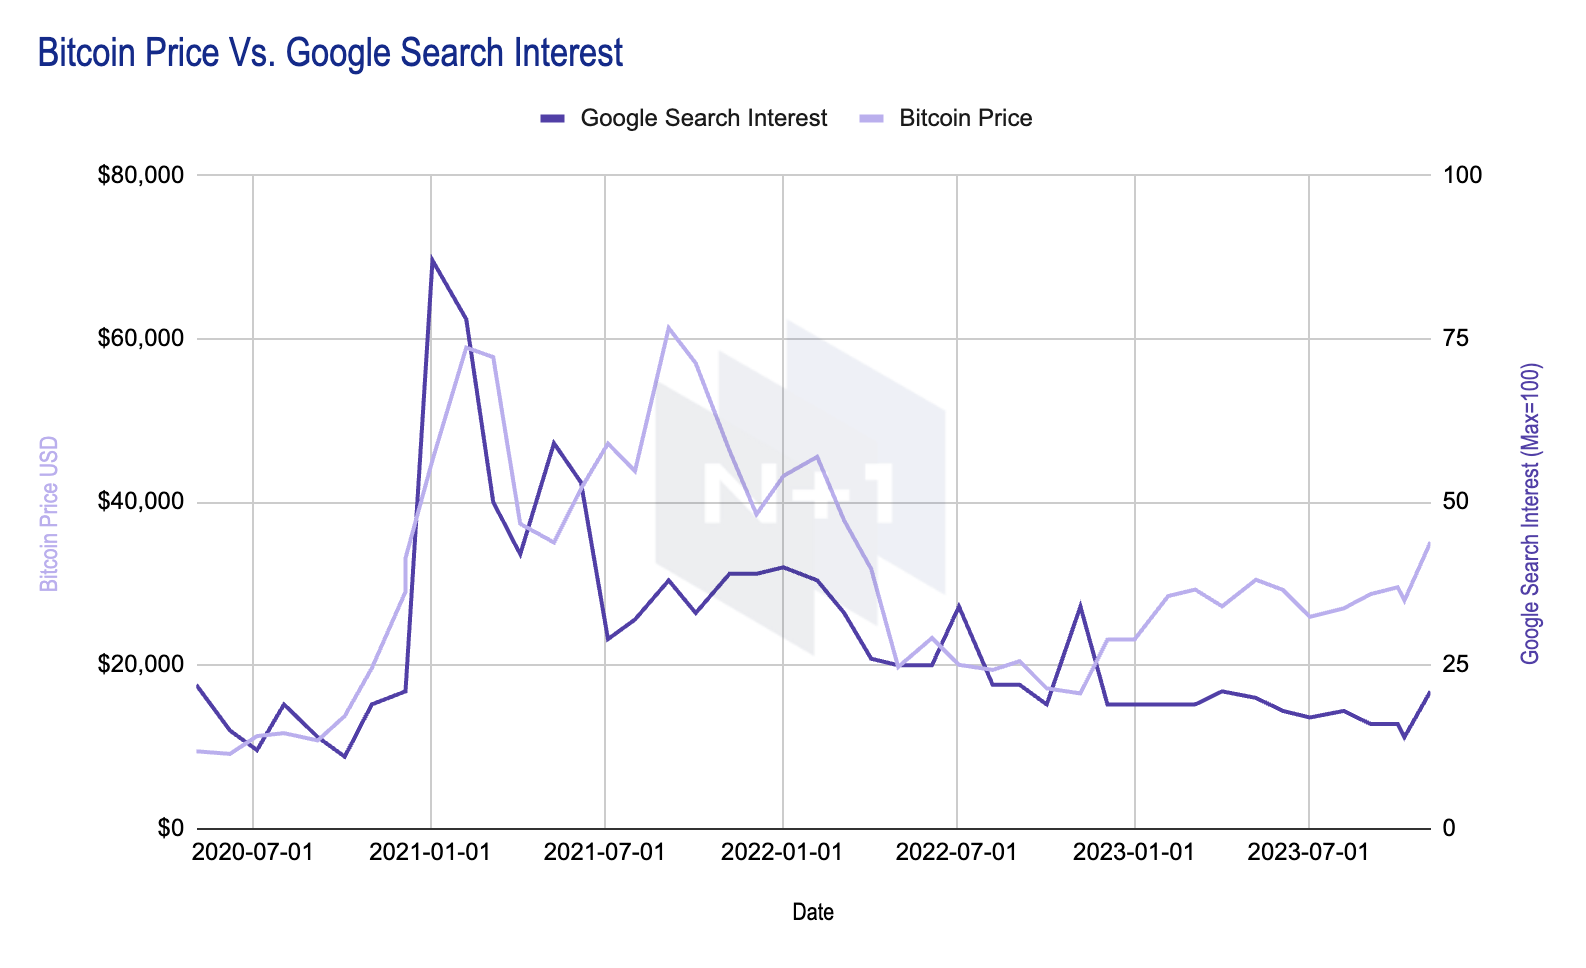
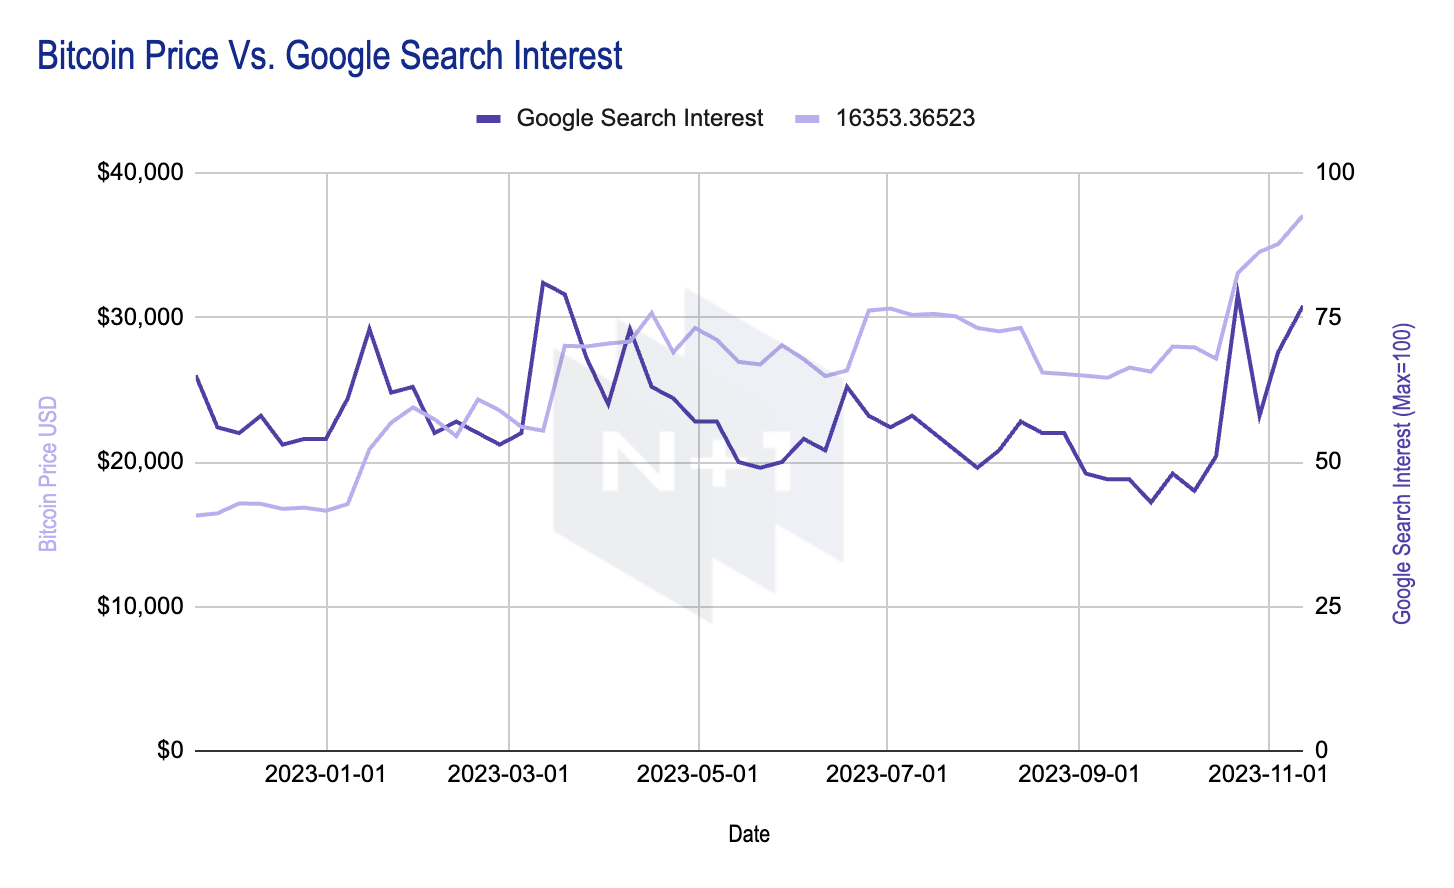
Google Trends - Measures the relative volume of Google searches over time. Google Trends shows the number of searches for a particular topic on Google’s search engine. We theorize that when these searches are increasing it reflects a rise in interest in coins or crypto developments and may be positively correlated with crypto prices. Moreover, crypto prices may have a negative correlation to searches as they peak or decline to extreme levels. This reflects situations of very high market exuberance or lack of interest which we might see at crypto market tops or bottoms. For example, the 2017 Bitcoin search peak of 100% gives a baseline for attention levels. Search quantities below this 2017 peak are potentially under attended or fairly attended periods.
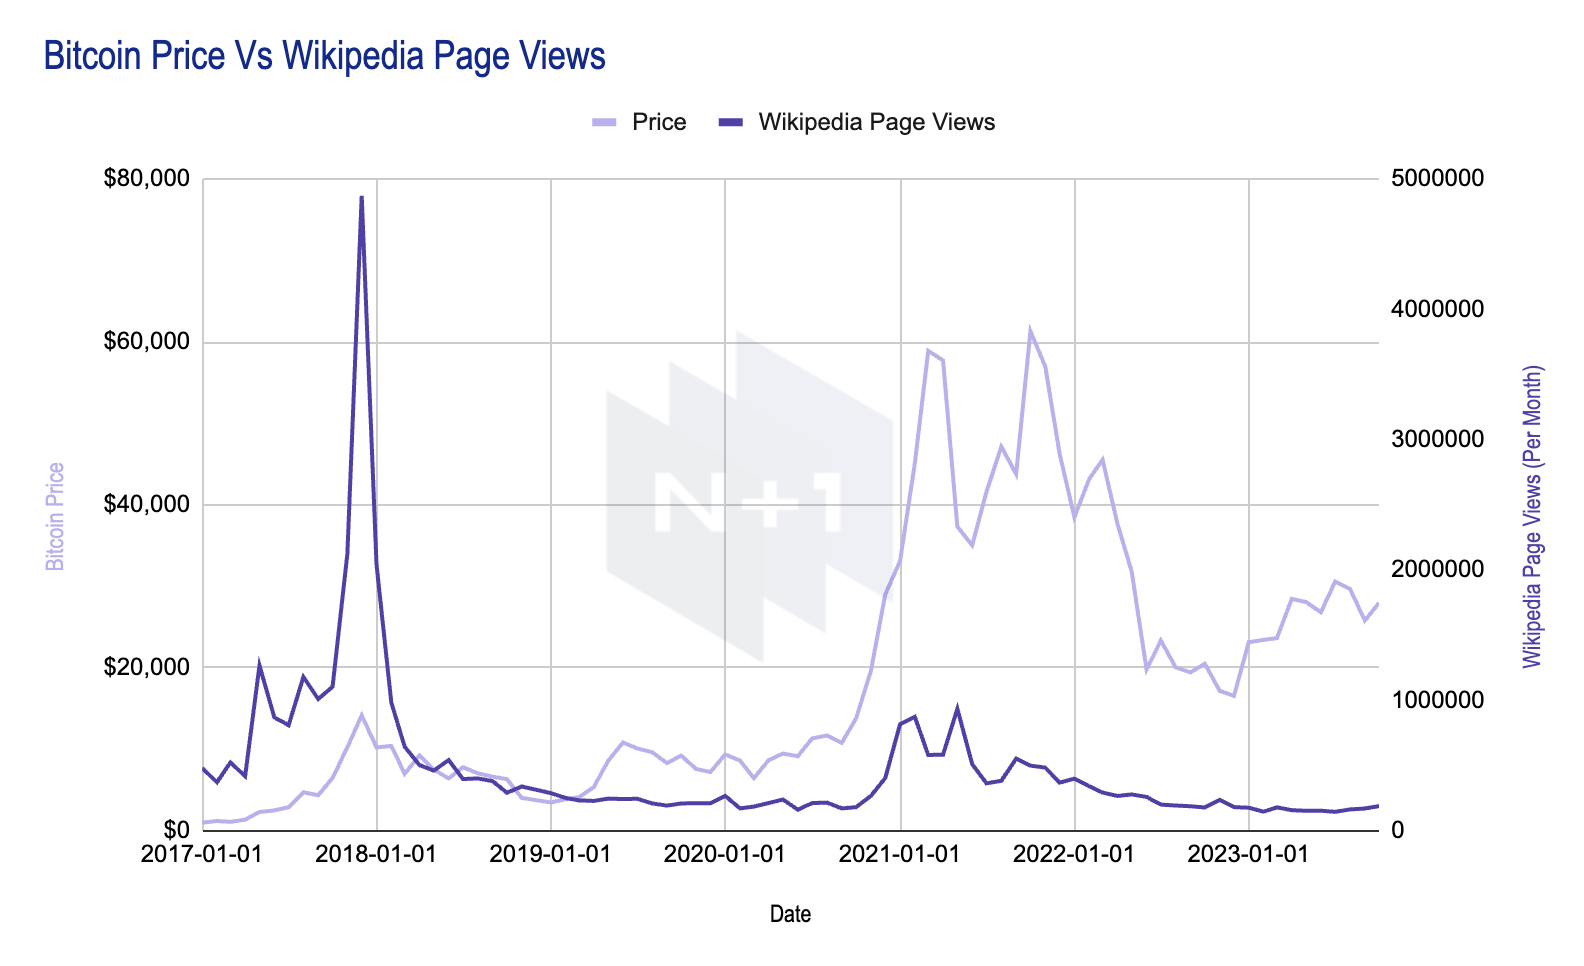
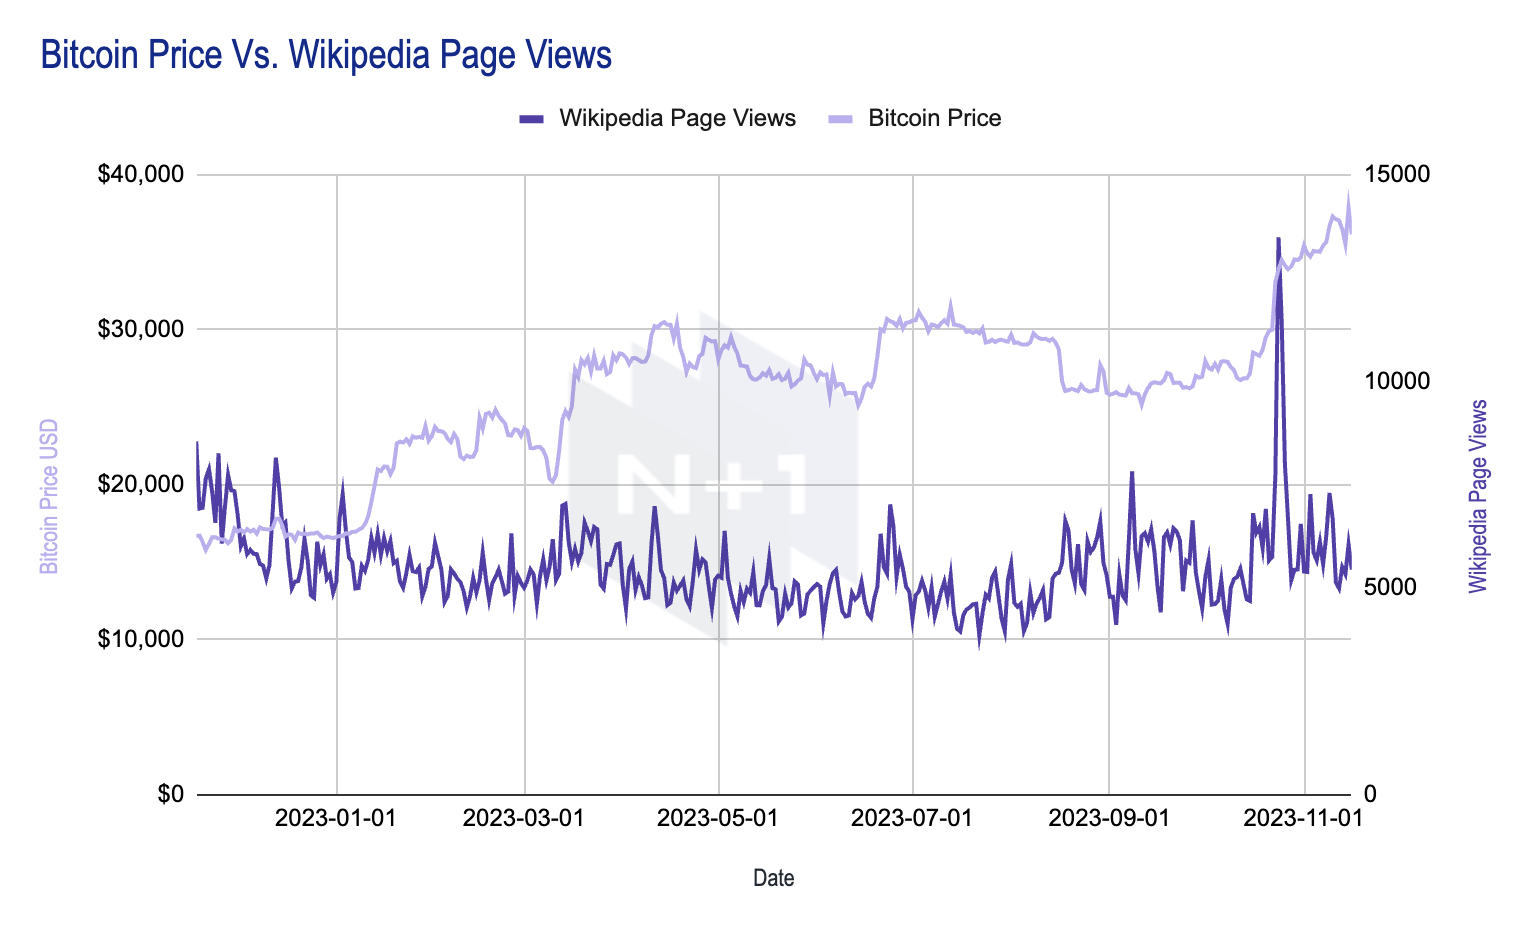
Wikipedia Page Views - Similar to Google trends, Wikipedia page views proxy the level of attention in the crypto market. Wikipedia page views typically indicate interest in topics and ideas. These page views may represent a desire to attain more detailed and specific knowledge in the crypto space. Moreover page views may show a more intense and serious interest in a topic compared to a Google search.
📊 Featured Chart
N+1 Insights is meant for informational purposes. It is not meant to serve as investment advice.