
Glossary
Glossary
This glossary was made to help our readers interpret our N+1 Action newsletter. Our newsletter features on-chain metrics, financial data and macro economic insights that we want to make accessible for every reader, even those who are new to investing or unfamiliar with cryptocurrency markets. The glossary is divided into sections that reflect our newsletter so you can easily discern what our insights mean.
AI Trading Insights/Portfolio Insights
Algorithmic Trading Table
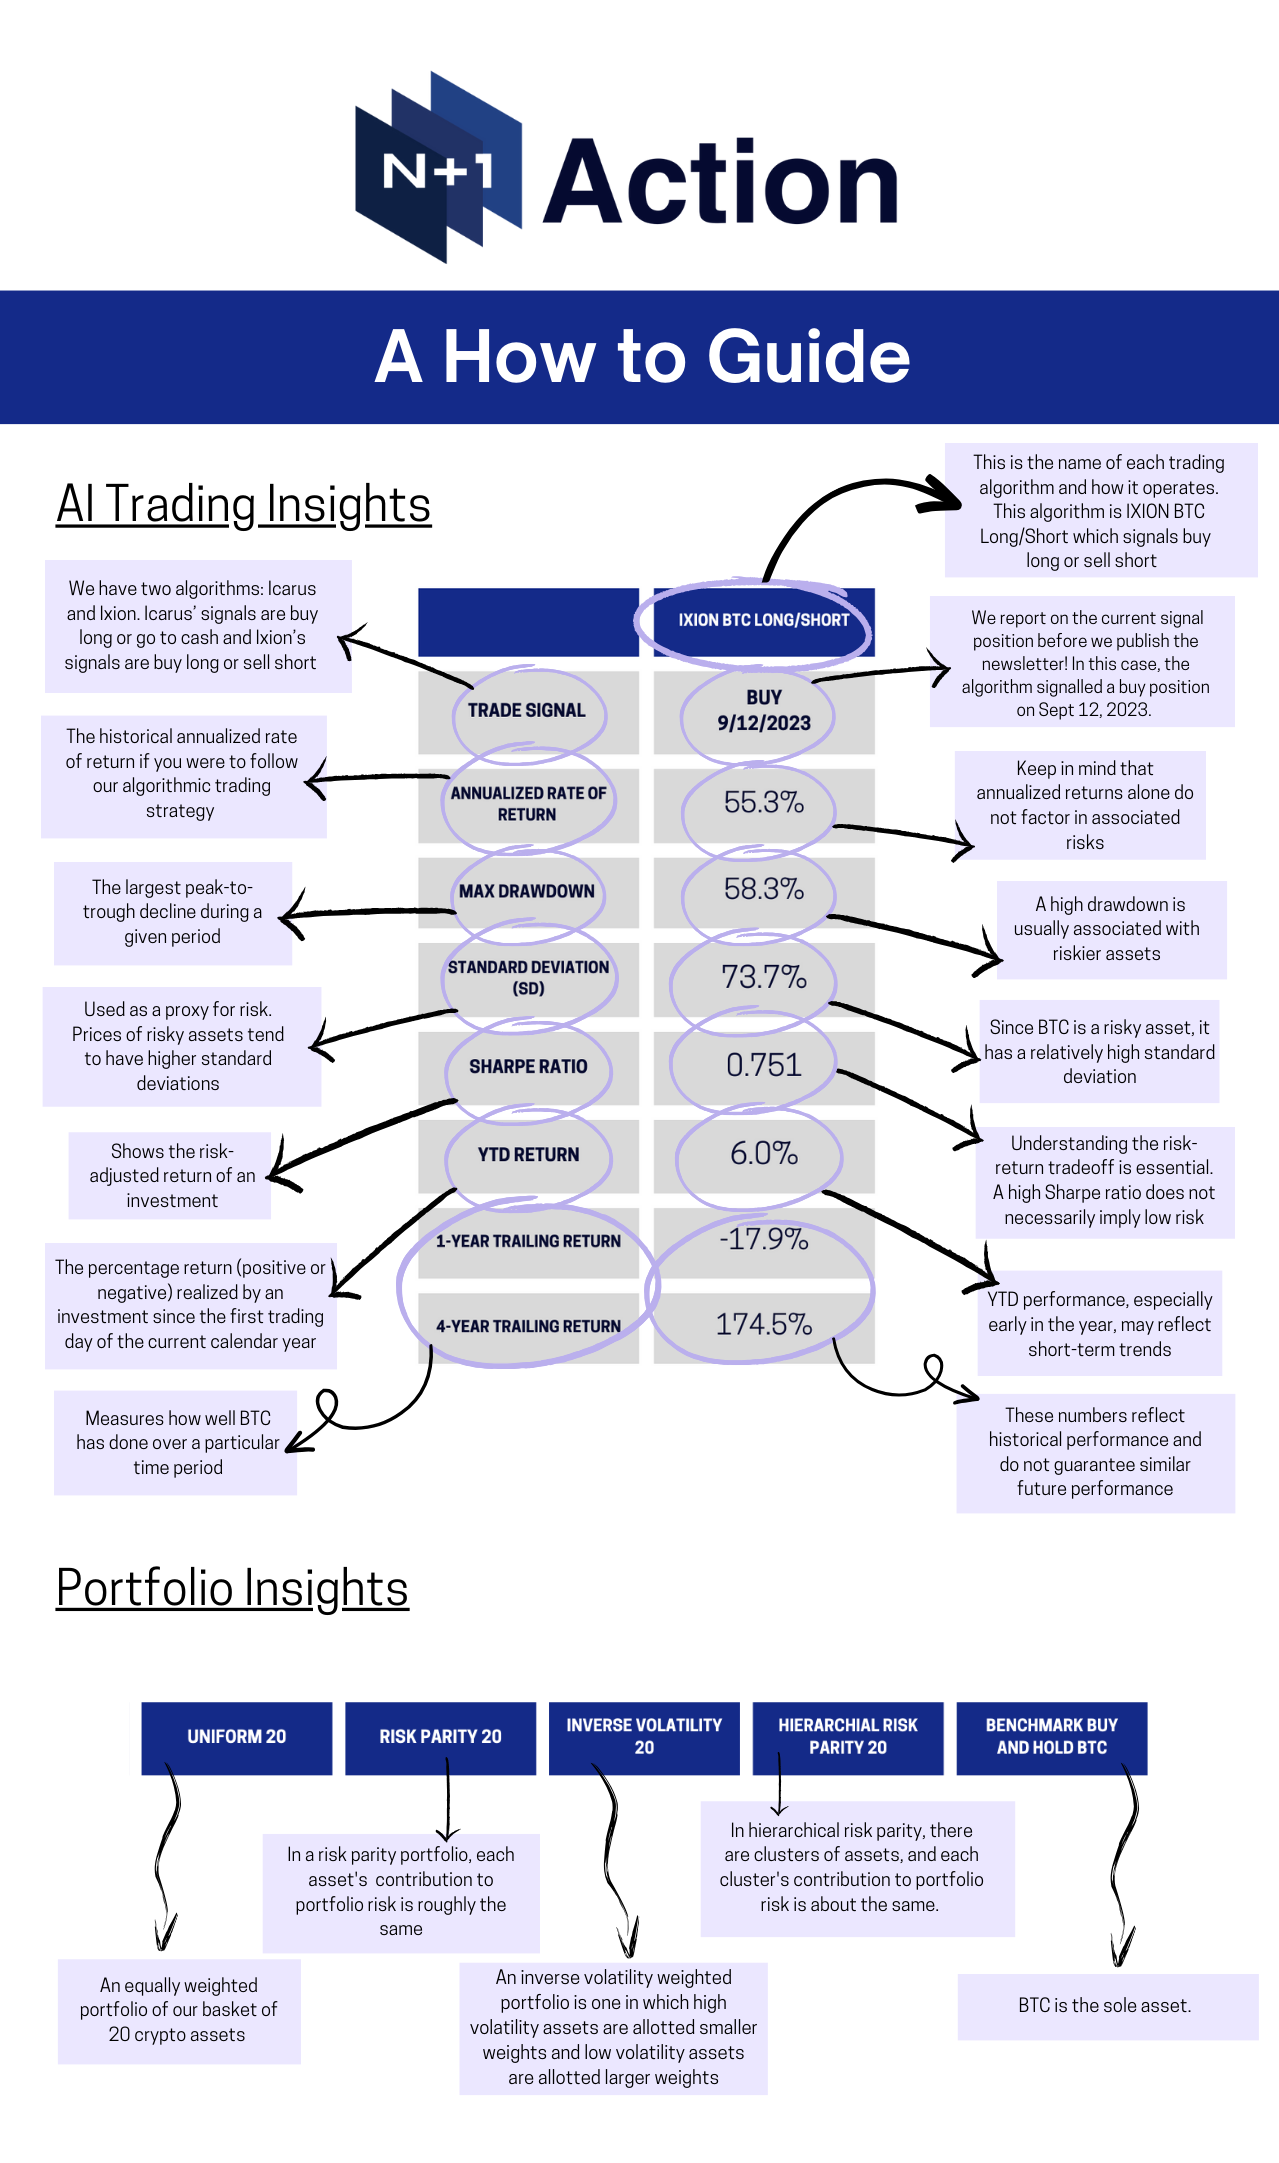
- Annualized Rate of Return - The equivalent annual return an investor receives over a given period, expressed as a percent.
- Drawdown - How much an investment, trading account or fund has fallen from its peak to trough. Drawdown is measured over a specific period, between two distinct dates and is expressed in dollar amounts or as a percentage. For example, if you invest $10,000 in Bitcoin, volatility could see your account dip to $9,000, but a previous uptrend pushed your account to its peak at $12,000. The drawdown measured from the account peak is $3,000 or 25%.
- Maximum Drawdown - The biggest percentage drop in value that a trading system has experienced from its previous highest point to its subsequent lowest point.
- Standard Deviation - Measures how widely prices are dispersed from the average price, indicating market volatility. If prices trade in a narrow range, SD will be low and indicate low volatility. Conversely, if prices swing up and down, SD will be high and indicate high volatility.
- Sharpe Ratio - Measures risk-adjusted relative returns, calculated by comparing its return to that of a risk-free asset. SR describes how much excess return you receive for the extra volatility you endure for holding a riskier asset. Excess returns over a period of time may signify more volatility and risk, rather than investing skill. Generally, a SR between 1 and 2 is good, between 2 and 3 is very good and higher than 3 is excellent.
Portfolio Table
- Downside Risk - The potential loss that can result from a fall in price of an asset from changing market conditions. Refers to the probability that an asset or security will fall in price. Downside risk is in contrast to upside potential which is the likelihood that an asset or security’s value will increase.
- Uniform - Allocates equal weights to each asset in a portfolio.
- Risk Parity - A portfolio allocation strategy that uses risk to determine allocations across various components of an investment portfolio. The main idea of the risk parity strategy is that all assets in the portfolio contribute in the same proportion to the risk of the portfolio.
- Inverse Volatility - A portfolio strategy where risk is measured with volatility and assets are weighted in inverse proportion to their risk. Assets that are more volatile receive lower weights.
- Hierarchical Risk Parity - Uses unsupervised machine learning to cluster assets in such a way that each cluster contributes an equal amount of risk (volatility) to the portfolio.
- Rebalancing - Periodically buying or selling the assets in a portfolio to regain and maintain the original, desired level of asset allocation. Levels are intended to match an investor's tolerance for risk and desire for reward.
Macro Insights
- NVT (Network Value to Transactions Ratio) - Describes the relationship between market capitalization and transfer volumes. With NVT, users can see the balance between bitcoin’s two primary value propositions: store of value (market cap) and settlement/payments network (transfer volume). A high NVT ratio indicates investors are pricing bitcoin at a premium, while a low ratio indicates investors are pricing bitcoin at a discount. A constant ratio indicates the current growth trend of both market cap and transfer volume are in equilibrium.
- MVRV Z-Score - Uses market value, realized value and Z-score to identify periods where bitcoin is extremely over or undervalued relative to its ‘fair value.’ When bitcoin price is in the upper band, it may pull back and after time in the lower band, it may rally.
- Stock to Flow - The Stock to Flow (S/F) Ratio is a popular model that assumes that scarcity drives value. It is defined as the ratio of the current stock of a commodity and the flow of new production, and is applied across many asset classes. Bitcoin's price has historically followed the S/F Ratio, making it a popular model for predicting future bitcoin valuations.
Media Insights
- Communication Science - Applying data science and communication theory to analyze public and financial discourse about blockchain and crypto markets.
- Google Trends - Measures the relative volume of Google searches over time.
- Wikipedia Page Views - Similar to Google trends, Wikipedia page views may proxy the level of attention in the crypto market. r/Bitcoin Subreddit Comments - The r/Bitcoin proxies the level of attention in community conversation about the crypto market.